


Use Edge Insights to gain historical and near real-time insights into threat profiles, performance, and CDN usage. It allows you to:
- Generate a report for security violations and CDN usage.
- Visualize where and how your content is being requested.
- Troubleshoot issues by analyzing security violations and delivery profiles for problematic traffic.
- Export data as a JSON file.
The primary function of these reports is to identify threat profiles, assess performance, and gather data on CDN usage. This data should not be used for billing purposes.
Basic Usage
Generating a report consists of performing the following steps:
-
Navigate to the Edge Insights page.
- From the Edgio Developer console, select the desired private or team space.
- Select the desired property.
- From the left-hand pane, select the desired environment from under the Environments section.
- From the left-hand pane, select Edge Insights.
-
Select one of the following data sources:
-
Access Logs: Use this data source to analyze CDN traffic.
- Full - last 6 hours: Contains all traffic for up to the last 6 hours.
- Sampled: Contains traffic that has been downsampled to 0.1% for up to the last 7 days.
- Sampled, BF:
- Sampled, SOC:
-
Analytics: Use this data source to analyze CDN traffic that has been downsampled to 0.1%.
-
Bot Manager Alerts: Use this data source to view bot rule violations of your WAF security application manager configuration that have been downsampled to 10%.
-
Edge Control: Use this data source to analyze how a new CDN configuration affects content delivery and performance.
-
Rate Limiting Alerts: Use this data source to view rate rule violations of your WAF security application manager configuration that have been downsampled to 10%.
-
WAF Alerts: Use this data source to view access rule, bot rule, custom rule, and managed rule violations of your WAF security application manager configuration.
-
-
Select the time period for which data will be returned.
Define a time period that does not exceed the retention period defined for the selected data source.
-
Optional. Define a filter for your report to gain deeper insights into security violations, key fields, or traffic patterns.
-
Edge Control Only: Define the configurations that will be compared and the type of data that will be analyzed.
-
From the Customer config version section, select two or more configurations.
-
Select the data that will be compared from the HTTP Status Code and Cache Status sections.
For example, you may select
TCP_MISSfrom the Cache Status section to compare whether cache misses increased as a result of your latest configuration update. -
Click Analyze.
-
Common Use Cases
The following common use cases are provided to demonstrate various ways in which you may use Edge Insights to gain insight into traffic patterns or to troubleshoot issues.
Was my software update delivered throughout the United States?
-
From the Data Source option, select
Access Logs (Full - last 6 hours). -
From the Time Period option, define the desired time period.
For example, if the software update was made available on a Monday at 3 p.m., then you would set the starting point to that date and time. By default, the ending point is automatically set to a recent timestamp and therefore allows you to view all available data from the starting point to the present.
-
Create a filter for the software update’s URL.
-
Click on + Add Filter.
-
Select
URL Path. -
Set it to the URL path for the desired software update package.
Specific URL Path Example: The following value filters for a specific URL:
/downloads/widgets.zipRecursive Example: The following value filters for all requests with the same base URL:
regex:/downloads/.\* -
Click Save.
-
-
From the Top Results section, select the
Country Namefield. -
From the pie chart, click on
United States. -
From the Top Results section, select the
HTTP Status Codefield. -
Review the status codes.
-
Optional. Dig into a specific status code by clicking on it and then reviewing log entries from the Logs section.
Why do I see a spike in 404 Not Found responses?
-
From the Data Source option, select
Access Logs (Full - last 6 hours). -
From the Top Results section, select the
HTTP Status Codefield.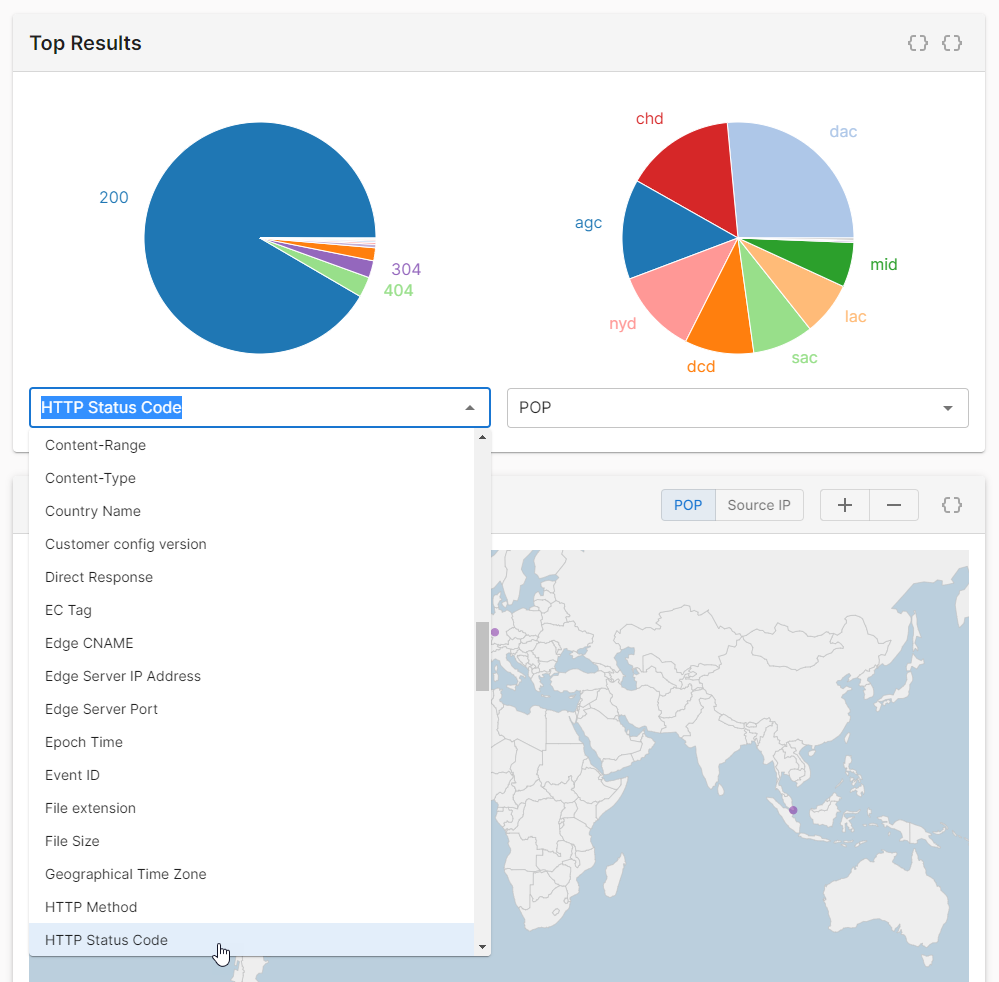
-
From the pie chart, click on
404.
-
From the Top Results section, select the
URL Pathfield. -
Review the top requests for that time period.
-
Optional. If you cannot detect a clear pattern, try narrowing the report’s time period.
For example, if the spike occurred on a Monday at 3 p.m., then you should generate a report for Monday from 2 p.m. to 4 p.m.
View detailed information for a request that results in a 404 Not found response by clicking on an entry in the Logs section.
Why do I see a traffic spike?
-
From the Data Source option, select
Access Logs (Full - last 6 hours). -
From the Time Period option, define a time period that covers that traffic spike.
For example, if the traffic spike occurred on a Monday at 3 p.m., then you should generate a report for Monday from 2 p.m. to 4 p.m.
-
From the Top Results section, select the
URL Pathfield. -
Review the top requests for that time period.
Why do I see a spike in WAF alerts?
-
From the Data Source option, select WAF Alerts.
-
From the Time Period option, define a time period that covers that spike.
For example, if the spike occurred on a Monday at 3 p.m., then you should generate a report for Monday from 2 p.m. to 4 p.m.
-
From the Top Results section, review the Rule Message chart. Click on a rule message to filter by it.
-
From the Top Results section, select a field related to the selected rule message. Click on the largest segment in the pie chart.
For example, if you filtered by the
Method is not allowed by policyrule message, then you should select theRequest Methodfield. -
From the Logs section, click on a log entry. Review key fields (e.g.,
urlanduser_agent).
Why do I see a spike in rate limited requests?
-
From the Data Source option, select Rate Limiting Alerts.
-
From the Time Period option, define a time period that covers that spike.
For example, if the spike occurred on a Monday at 3 p.m., then you should generate a report for Monday from 2 p.m. to 4 p.m.
-
From the Top Results section, select the
Client IPfield. -
Review the top requests for that time period.
-
Optional. If you cannot detect a clear pattern, try selecting a region field (e.g.,
City Name) from within the Top Results section.
Sharing Data
You may share an entire report or specific data with other users.
-
Entire Report: Share an Edge Insights report with another Edgio team member by providing the report’s URL.
Example:
https://edge-insights.edgio.app/?avg=0&bin=auto&end_time=1638817682&f=%7B%22geoip_country_name%22%3A%22United+States%22%7D&fstatus=%7B%22geoip_country_name%22%3A%7B%22value%22%3A%22United+States%22%2C%22active%22%3Atrue%7D%7D>=chart1&h=0&legend=0&log=0&mt=graph_by_pop&nm=false¬f=%7B%7D¬fstatus=%7B%7D&p=1&pc1s=status_code&pc2s=geoip_country_name&pp=10&prefix=&quantiles=&selectedChart=histogram&selectedQuantitativeField=bytes_in&start_time=1638212206&ti=604800&topn=10&ttr=10&vs=&vt=accesslog -
Specific Data: Click on the
 icon next to the data that you would like to share. Edgio will load the corresponding JSON data in a new window or tab. You should then either:
-
Share the JSON data with the desired individual(s).
-
Share the data’s URL with another Edgio team member.
Example:
https://edge-insights.edgio.app/api/proxy/v0.7/accesslog-sc-bf/count?filters=%7B%22geoip_country_name%22%3A%22United%20States%22%7D&end_time=1638817682&start_time=1638212206&size=10&per_page=10&page=1
-
You must establish an Edgio session before attempting to load an Edgio URL that points to a specific report or data. Attempting to load this type of URL without an active Edgio session may load the Edgio’s home page instead.
Data Downsampling and Retention
Our policy on downsampling data and the amount of time that we store it varies according to data source.
| Data Source | Downsampling | Retention Schedule |
|---|---|---|
| WAF Alerts | Not Downsampled | 30 days |
| Rate Limiting Alerts | 10% | 30 days |
| Access Logs, (Full - last 6 hours) | Not Downsampled | 6 hours |
| Access Logs, (Sampled) | 0.1% | 7 days |
| Access Logs, (Sampled, BF) | ? | ? days |
| Access Logs, (Sampled, SOC) | ? | ? days |
| Analytics | 0.1% | 7 days |
| Edge Control | Not Downsampled | 7 days |
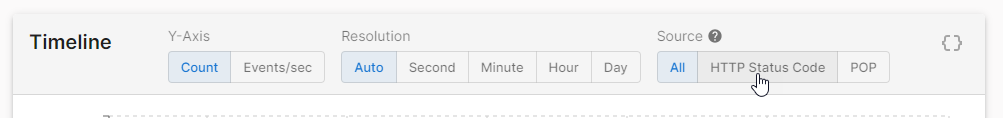
Time Chart
The time chart (aka line graph) graphs the current report’s data over time.
Key information:
-
By default, a single line plots all requests over time. Graph the top results for a specific field by clicking on the button that corresponds to that field. If the desired field is not listed, select it from within the Top Results section.
By default, a line graph includes up to the 10 most popular entries. Customize this limit through the Limit Results to Top option from the left-hand pane. This option also affects the maximum number of unique entries that may be listed within a Top Result chart.
Use the layout options to determine whether all data will be plotted on a single or multiple line charts.
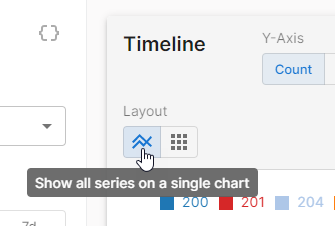
- Single Line Chart: By default, all data is plotted within a single chart with individual lines for each entry. Switch from multiple line charts to a single line chart by clicking the
 icon.
icon.
Click on the color-coded entries within the legend to hide or show them.
- Multiple Line Charts: Generate a line graph for each entry by clicking the
 icon.
icon.
- Single Line Chart: By default, all data is plotted within a single chart with individual lines for each entry. Switch from multiple line charts to a single line chart by clicking the
-
Hovering over the line graph will indicate the exact number of requests that were plotted for that time slot.
-
By default, Edge Insights plots data using an optimal time interval for the report’s time range. You may override this by switching the resolution from Auto to the desired time interval.
The report’s time range determines the set of available resolutions.
-
View the data used to plot this chart by clicking on the
icon. Upon clicking this icon, Edgio displays this data in JSON format within a new tab.
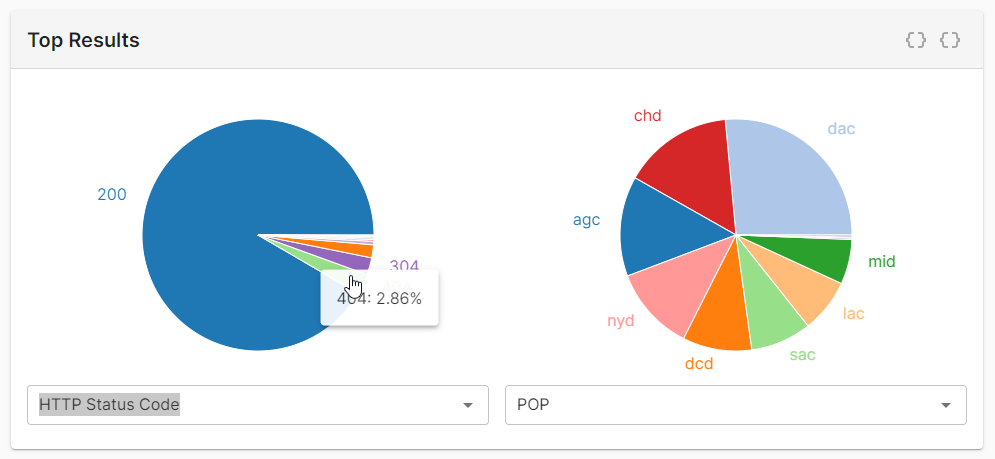
Top Results Charts
The top results charts displays the top results for 2 fields.
Key information:
-
By default, each chart may include up to the 10 most popular entries. Customize this limit through the Limit Results to Top option from the left-hand pane. This option also affects the maximum number of unique entries that may be graphed within the time chart.
-
The Top Results charts only include statistically significant entries. A gray slice called
Rest...represents all remaining traffic.Certain fields may generate a pie chart that solely consists of a
Rest...slice. This behavior typically indicates either that there are many unique entries or that this field is not applicable to the majority of requests.Example:
In the following illustration, the
Client Postal Codepie chart returns a single slice calledRest.... The traffic represented by this pie chart is distributed throughout the world and therefore no single postal code was responsible for a statistically significant traffic segment. TheClient Region Namepie chart, on the other hand, displays the top 10 regions. Those regions were responsible for majority of traffic included in this report.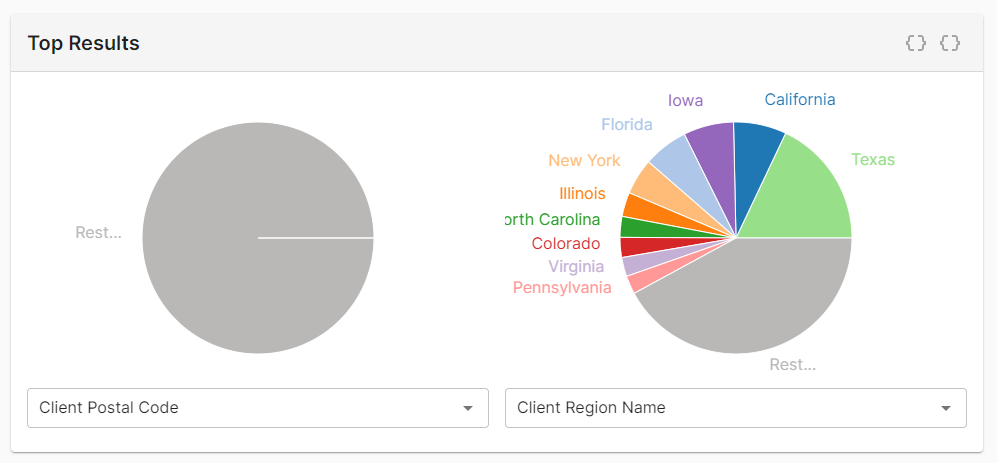
Increasing the Limit Results to Top option to 30 provides visibility into additional POPs that were responsible for serving the majority of your traffic. Notice in the following illustration that the
Rest...slice is now smaller since the pie chart now reports data for regions that were previously included by that slice.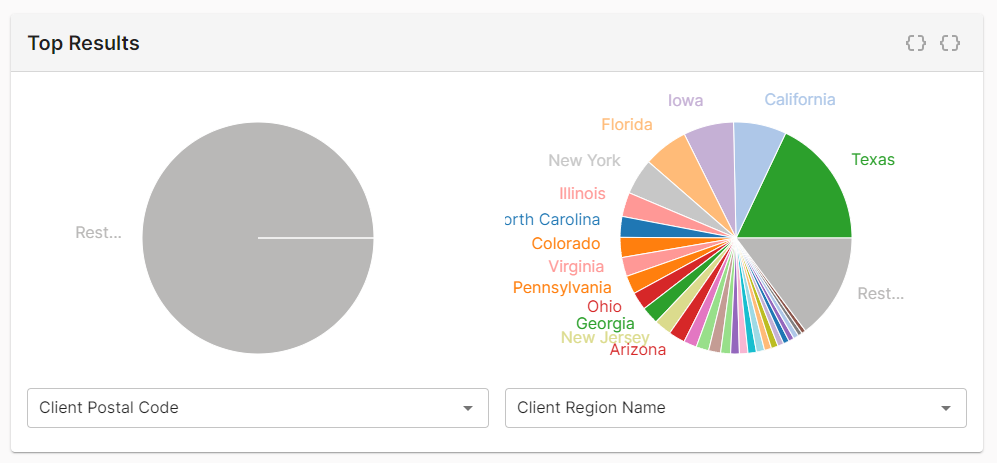
-
You may switch a chart’s field by selecting a new one directly underneath the chart. The available set of fields vary by data source.
-
The fields selected in the Top Results section determine the available set of sources within the time chart.
-
Filter the entire report by clicking on a value within the chart.
-
Filters persist until they are manually removed from the Filters section in the left-hand pane. This allows you to quickly filter on multiple fields. Apply an additional filter by switching to another field and then clicking on the desired entry.
Filtering
Filtering is critical for gaining deeper insights into your data.
To filter your report
-
From the Top Results section, select the field that contains the data that you would like to filter.
-
From the pie chart, click on the value by which you would like to filter.
The Filters section in the left-hand pane is immediately updated to display your filter query.
Example:
From the Top Results section, select the
HTTP Status Codefield and then click on404to create the following filter: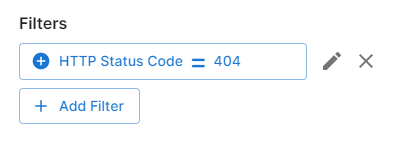
Perform the following common tasks from within the Filters section in the left-hand pane:
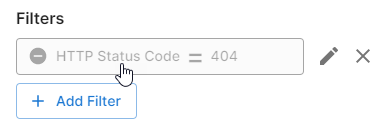
-
Click on a filter to toggle between enabling and disabling it. Gray font indicates that the filter has been disabled.
-
Modify a filter by clicking the
 icon next to it.
 -
Manually add a filter by performing the following steps:
-
Click on + Add Filter.
-
Select the desired field.
The set of available fields varies by data source. View field definitions for:
Access Logs, Analytics, Bot Manager Alerts, Rate Limiting Alerts, WAF Alerts -
Optional. Click on
=to toggle between filtering for requests that:- =: Match the specified value.
- ≠: Do not match the specified value.
Example:
Filter for requests that do not originate from a specific country by selecting the
Country Namefield, toggling this symbol to≠, and then defining the name of the desired country. -
Set the value through which the report will be filtered.
Advanced (Regular Expressions): If you are filtering by a field that reports a string value, then you may define a regular expression through the following syntax:
regex:<REGULAR EXPRESSION>Example:
Use this regular expression on the
Country Namefield to filter for requests that originated in United States, Canada, or Mexico:regex:United States|Canada|Mexico -
Click Save.
-
Log Data
Log data provides contextual information about a request that allows you to gain deeper behavioral insight into threat detection and CDN usage. View the log data associated with the current report from within the Logs section.
Key information:
-
Log entries are returned as paginated results. By default, we provide 10 log entries per page. You may increase this value up to 1,000 through the Logs per page option.
-
View a specific log entry by clicking on it.
-
View log data for the current page by clicking on the
icon. Upon clicking this icon, Edge Insights displays the current page’s log data in JSON format within a new tab. -
Edge Insights restricts log retrieval to 10,000 log entries. If the current report consists of more log entries, then you may only retrieve log data for 10,000 of the most recent requests. This limit solely applies to log retrieval. Your report’s time chart and Top Results charts display all available data without regard to this limit.
Edge Insights is not meant to be used as a log retrieval or log archival tool. Use Real-Time Log Delivery to automatically archive log data to one or more destinations.
Access Logs
Use this data source to analyze CDN traffic. This data provides historical and near real-time visibility into your CDN traffic at a high-level.
For data sources that have been downsampled to 0.1%, calculate an approximation of your actual total events by multiplying your total events by 1,000. For example, if your total events reports 235K, then the approximate number of requests for that time period is 235,000,000.
Each Access Log field is defined below.
| Field | Description |
|---|---|
| ASN | Indicates the autonomous system number (ASN) for the autonomous system (AS) from which the request originated. |
| Bytes In | Indicates the sum of the number of bytes read from both the requesting client and the origin server. Returns 0 for blocked requests. |
| Bytes Out | Indicates the number of bytes in the response sent from the edge server to the client. Returns 0 for blocked requests. |
| Bytes Out without Header | Indicates the number of bytes in the payload sent from the edge server to the client. Returns 0 for blocked requests. |
| Cache Status | Indicates the cache status code that was generated by the request. This code indicates how the request was handled by the CDN with regards to caching. |
| Chosen SSL Signature Algorithm | Indicates the algorithms used to generate and encrypt a hash for this TLS request. Example: RSA-SHA256 |
| City Name | Indicates the city from which the request originated. |
| Client Content Type | Indicates the media type (aka content type) for the requested content. Example: application/javascript |
| Client IP | Identifies the IP address of the client from which the request originated. |
| Client SSL Ciphers | Indicates the set of cipher suites supported by the client that submitted the request. |
| Client VIP | Reserved for future use. |
| Common Header | Reserved for future use. |
| Connection ID | Reserved for future use. |
| Content Range | Indicates the location of a ranged request’s payload within the full message. This information is defined within the Content-Range header. Example: bytes 0-4095/8388608 |
| Content Type | Indicates the media type (aka content type) for the requested content. Example: application/javascript |
| Continent Code | Indicates the continent from which the request originated using one of the following codes: AF: Africa AS: Asia EU: Europe NA: North America OC: Oceania SA: South and Central America Empty String: Unknown continent |
| Country Code | Identifies the country from which the request originated by its country code. |
| Country Name | Identifies the country from which the request originated by its name. |
| Customer config version | Identifies the version of the CDN configuration that was in effect when this request was processed. Updating your CDN configuration increments your CDN configuration version. |
| Direct Response | Reserved for future use. |
| EC Tag | Reserved for future use. |
| Epoch Time | Indicates the timestamp, in Unix time (seconds), at which our CDN received the request. |
| Event ID | Indicates the unique ID assigned to this request. |
| File extension | Indicates the request’s file extension. Example: .js |
| File size | Indicates the size, in bytes, of the requested asset (i.e., response body). |
| Forwarded for IP | Indicates the requester’s IP address. |
| Geographical Latitude | Indicates the approximate latitude of the postal code, city, subdivision, or country associated with the client’s IP address. A null value is reported when the client’s latitude cannot be determined. |
| Geographical Longitude | Indicates the approximate longitude of the postal code, city, subdivision, or country associated with the client’s IP address. A null value is reported when the client’s longitude cannot be determined. |
| Geographical Postal Code | Reserved for future use. |
| Geographical Real Region Name | Reserved for future use. |
| Geographical Region Name | Indicates the name of the region from which the request originated. Example: Sao Paulo |
| Geographical Time Zone | Indicates the name of the time zone that corresponds to the region from which the request originated. Example: America/Sao_Paulo |
| File size | Indicates the size, in bytes, of the requested asset (i.e., response body). |
| HTTP Status | Indicates the HTTP status message for the response generated by an origin server, an Origin Shield server, an ADN Gateway server, or an edge server. Example: HTTP_STATUS_OK |
| HTTP Status Code | Indicates the HTTP status code for the response generated by an origin server, an Origin Shield server, an ADN Gateway server, or an edge server. Example: 200 |
| IP Version | Indicates the client’s IP version number. Valid values are: `4 |
| LC | Reserved for future use. |
| Origin URL | Indicates the request’s URL path and query string. This URL path starts directly after the content access point. It excludes the protocol, hostname, and content access point. Example: /resources/script.js |
| Pipeline Time | Indicates the number of seconds between when the request was received by our network and ingestion. |
| Platform | Returns cache. |
| POP | Identifies the POP that handled the client’s request by its three-letter abbreviation. |
| Proxy Address | Indicates the IP address to which the request was proxied. |
| Proxy ASN | Indicates the ASN through which the request was proxied. |
| Proxy hard error | Indicates the error message that occurred when proxying the request. Example: The following sample value indicates that an error did not occur when proxying the request: HARD_ERR_NONE |
| Proxy Port | Indicates the port to which the request was proxied. |
| Proxy Version | Reserved for future use. |
| Query String | Indicates the request’s query string. |
| QUIC version | Indicates the request’s QUIC version. |
| Range | Indicates the requested range of bytes as defined by the Range request header. Example: bytes=0-12022 |
| Receiving Host | Identifies the host that received the request. |
| Referer | Indicates the request’s referrer as defined by the Referer request header. |
| Request Count | Reserved for future use. |
| Request ID | Indicates the unique ID assigned to this request. |
| Request Method | Indicates the request’s HTTP method. Example: HTTP_METHOD_GET |
| Request Protocol | Indicates the request’s HTTP version. Example: HTTP_2_0 |
| Server Address | Indicates the IP address for the edge server that processed the request. |
| Server Name | Indicates the name of the edge server that processed the request. |
| Server Port | Indicates the port number on an edge server to which the client directed a request. Valid values are: 80: HTTP request 443: HTTPS request |
| SSL Cipher Name | Indicates the cipher suite used in the handshake between the client that submitted the request and one of our servers. Example: TLS_AES_256_GCM_SHA384 |
| SSL Client Cipher Name | Reserved for future use. |
| SSL Client Signature Algorithms | Indicates the set of TLS signature algorithms supported by the client that submitted the request. |
| SSL Protocol | Indicates the TLS protocol version used for the communication between the client and our network. Example: TLSv1.3 |
| TCP Congestion Algorithm | Indicates the network congestion avoidance algorithm for TCP used to process the request. Example: cubic |
| Throughput | Reserved for future use. |
| Timestamp | Indicates the timestamp at which our CDN received the request. Syntax: YYYY-MM-DDThh:mm:ss:ffZ Example: 2022-11-14T18:36:11Z |
| Total Connection Time | Indicates the length of time, in seconds, that it took to send a response to the client. This metric measures the duration between when an edge server receives a request and when it finishes sending the response to the client. This field does not take into account network time. Example: 0.000582 |
| URI | Indicates the request’s URL path and query string. This URL path starts directly after the hostname and it excludes the protocol and hostname. Example: This example assumes that the client submitted the following request: https://cdn.example.com/script.js Our service logs the following value for this field: /resources/script.js |
| URL | Indicates the request’s URL. Example: https://cdn.example.com/resources/script.js |
| User Agent | Indicates the user agent that submitted the request. This information is derived from the User-Agent request header. |
| Write Time Used | Indicates the length of time, in seconds, that it took an edge server to write the response. This metric measures the duration between when an edge server starts writing the response and when it finishes sending the response to the client. Our servers forward data as it is read. This means that the read_time and write_time reported for an asset spans over an overlapping time period. This field does not take into account network time. Example: 2.9999e-05 |
| X Midgress | Indicates whether the request was proxied through an additional CDN server (e.g., edge server to Origin Shield server). This field reports __na__ for requests that did not have midgress traffic. |
Analytics
Use this data source to analyze CDN traffic that has been downsampled to 0.1%. This data provides historical and near real-time visibility into your CDN traffic at a high-level.
Calculate an approximation of your actual total events by multiplying your total events by 1,000. For example, if your total events reports 100K, then the approximate number of requests for that time period is 100,000,000.
Each Analytics field is defined below.
| Field | Description |
|---|---|
| ASN | Indicates the autonomous system number (ASN) for the autonomous system (AS) from which the request originated. |
| Bytes In | Indicates the sum of the number of bytes read from both the requesting client and the origin server. Returns 0 for blocked requests. |
| Bytes Out | Indicates the number of bytes in the response sent from the edge server to the client. Returns 0 for blocked requests. |
| Bytes Out without Header | Indicates the number of bytes in the payload sent from the edge server to the client. Returns 0 for blocked requests. |
| Cache Status | Indicates the cache status code that was generated by the request. This code indicates how the request was handled by the CDN with regards to caching. |
| Chosen SSL Signature Algorithm | Indicates the algorithms used to generate and encrypt a hash for this TLS request. Example: RSA-SHA256 |
| City Name | Indicates the city from which the request originated. |
| Client Content Type | Indicates the media type (aka content type) for the requested content. Example: application/javascript |
| Client IP | Identifies the IP address of the client from which the request originated. |
| Client SSL Ciphers | Indicates the set of cipher suites supported by the client that submitted the request. |
| Client VIP | Reserved for future use. |
| Common Header | Reserved for future use. |
| Connection ID | Reserved for future use. |
| Content Range | Indicates the location of a ranged request’s payload within the full message. This information is defined within the Content-Range header. Example: bytes 0-4095/8388608 |
| Content Type | Indicates the media type (aka content type) for the requested content. Example: application/javascript |
| Continent Code | Indicates the continent from which the request originated using one of the following codes: AF: Africa AS: Asia EU: Europe NA: North America OC: Oceania SA: South and Central America Empty String: Unknown continent |
| Country Code | Identifies the country from which the request originated by its country code. |
| Country Name | Identifies the country from which the request originated by its name. |
| Customer config version | Identifies the version of the CDN configuration that was in effect when this request was processed. Updating your CDN configuration increments your CDN configuration version. |
| Direct Response | Reserved for future use. |
| EC Tag | Reserved for future use. |
| Epoch Time | Indicates the timestamp, in Unix time (seconds), at which our CDN received the request. |
| Event ID | Indicates the unique ID assigned to this request. |
| File extension | Indicates the request’s file extension. Example: .js |
| File size | Indicates the size, in bytes, of the requested asset (i.e., response body). |
| Forwarded for IP | Indicates the requester’s IP address. |
| Geographical Latitude | Indicates the approximate latitude of the postal code, city, subdivision, or country associated with the client’s IP address. A null value is reported when the client’s latitude cannot be determined. |
| Geographical Longitude | Indicates the approximate longitude of the postal code, city, subdivision, or country associated with the client’s IP address. A null value is reported when the client’s longitude cannot be determined. |
| Geographical Postal Code | Reserved for future use. |
| Geographical Real Region Name | Reserved for future use. |
| Geographical Region Name | Indicates the name of the region from which the request originated. Example: Sao Paulo |
| Geographical Time Zone | Indicates the name of the time zone that corresponds to the region from which the request originated. Example: America/Sao_Paulo |
| File size | Indicates the size, in bytes, of the requested asset (i.e., response body). |
| HTTP Status | Indicates the HTTP status message for the response generated by an origin server, an Origin Shield server, or an edge server. Example: HTTP_STATUS_OK |
| HTTP Status Code | Indicates the HTTP status code for the response generated by an origin server, an Origin Shield server, an ADN Gateway server, or an edge server. Example: 200 |
| IP Version | Indicates the client’s IP version number. Valid values are: `4 |
| LC | Reserved for future use. |
| Origin URL | Indicates the request’s URL path and query string. This URL path starts directly after the content access point. It excludes the protocol, hostname, and content access point. Example: /resources/script.js |
| Pipeline Time | Indicates the number of seconds between when the request was received by our network and ingestion. |
| Platform | Returns cache. |
| POP | Identifies the POP that handled the client’s request by its three-letter abbreviation. |
| Proxy Address | Indicates the IP address to which the request was proxied. |
| Proxy ASN | Indicates the ASN through which the request was proxied. |
| Proxy hard error | Indicates the error message that occurred when proxying the request. Example: The following sample value indicates that an error did not occur when proxying the request: HARD_ERR_NONE |
| Proxy Port | Indicates the port to which the request was proxied. |
| Proxy Version | Reserved for future use. |
| Query String | Indicates the request’s query string. |
| QUIC version | Indicates the request’s QUIC version. |
| Range | Indicates the requested range of bytes as defined by the Range request header. Example: bytes=0-12022 |
| Receiving Host | Identifies the host that received the request. |
| Referer | Indicates the request’s referrer as defined by the Referer request header. |
| Request Count | Reserved for future use. |
| Request ID | Indicates the unique ID assigned to this request. |
| Request Method | Indicates the request’s HTTP method. Example: HTTP_METHOD_GET |
| Request Protocol | Indicates the request’s HTTP version. Example: HTTP_2_0 |
| Server Address | Indicates the IP address for the edge server that processed the request. |
| Server Name | Indicates the name of the edge server that processed the request. |
| Server Port | Indicates the port number on an edge server to which the client directed a request. Valid values are: 80: HTTP request 443: HTTPS request |
| SSL Cipher Name | Indicates the cipher suite used in the handshake between the client that submitted the request and one of our servers. Example: TLS_AES_256_GCM_SHA384 |
| SSL Client Cipher Name | Reserved for future use. |
| SSL Client Signature Algorithms | Indicates the set of TLS signature algorithms supported by the client that submitted the request. |
| SSL Protocol | Indicates the TLS protocol version used for the communication between the client and our network. Example: TLSv1.3 |
| TCP Congestion Algorithm | Indicates the network congestion avoidance algorithm for TCP used to process the request. Example: cubic |
| Throughput | Reserved for future use. |
| Timestamp | Indicates the timestamp at which our CDN received the request. Syntax: YYYY-MM-DDThh:mm:ss:ffZ Example: 2022-11-14T18:36:11Z |
| Total Connection Time | Indicates the length of time, in seconds, that it took to send a response to the client. This metric measures the duration between when an edge server receives a request and when it finishes sending the response to the client. This field does not take into account network time. Example: 0.000582 |
| URI | Indicates the request’s URL path and query string. This URL path starts directly after the hostname and it excludes the protocol and hostname. Example: This example assumes that the client submitted the following request: https://cdn.example.com/script.js Our service logs the following value for this field: /resources/script.js |
| URL | Indicates the request’s URL. Example: https://cdn.example.com/resources/script.js |
| User Agent | Indicates the user agent that submitted the request. This information is derived from the User-Agent request header. |
| Write Time Used | Indicates the length of time, in seconds, that it took an edge server to write the response. This metric measures the duration between when an edge server starts writing the response and when it finishes sending the response to the client. Our servers forward data as it is read. This means that the read_time and write_time reported for an asset spans over an overlapping time period. This field does not take into account network time. Example: 2.9999e-05 |
| X Midgress | Indicates whether the request was proxied through an additional CDN server (e.g., edge server to Origin Shield server). This field reports __na__ for requests that did not have midgress traffic. |
Bot Manager Alerts
Use the Bot Manager Alerts data source for historical and near real-time analysis of recently detected bot traffic.
Edge Control
Use this data source to analyze how a new CDN configuration affects content delivery and performance.
Rate Limiting Alerts
Use the Rate Limiting Alerts data source for historical and near real-time analysis of recently rate limited requests. For example, use this data to:
- Understand the severity of rate limited requests.
- Identify the countries from which rate limited traffic originated.
- Identify key individual offenders by their IP address.
- View detailed information that describes a rate limited request.
Logging for rate limited requests is downsampled to 10% due to the volume of requests that may occur during a single incident (e.g., volumetric Distributed Denial-of-Service attack).
Calculate an approximation of your actual total events by multiplying your total events by 10. For example, if your total events reports 325K, then the approximate number of requests for that time period is 3,250,000.
Edge Insights retains WAF data, including rate limited requests, for 30 days.
Each Rate Limiting field is defined below.
| Fields | Description |
|---|---|
| Account Type | Reserved for future use. |
| Bytes In | Indicates the sum of the number of bytes read from both requesting client and the origin server. Returns 0 for blocked requests. |
| Bytes Out | Indicates the number of bytes in the response sent from the edge server to the client. Returns 0 for blocked requests. |
| Cache Status | Indicates the cache status code that was generated by the request. This code indicates how the request was handled by the CDN with regards to caching. |
| City Name | Indicates the city from which the request originated. |
| Client IP | Identifies the IP address of the client from which the request originated. |
| Common Header | Reserved for future use. |
| Content Type | Reserved for future use. |
| Country Code | Identifies the country from which the request originated by its country code. |
| Country Name | Identifies the country from which the request originated by its name. |
| Epoch Time | Indicates the timestamp, in Unix time (seconds), at which our CDN received the request. |
| File extension | Indicates the request’s file extension. |
| Host | Indicates the Host header value sent in the client’s request to the CDN. |
| id | Reserved for future use. |
| LC | Reserved for future use. |
| POP | Identifies the POP that handled the client’s request by its three-letter abbreviation. |
| Rate Limiting Action Duration | Indicates the number of seconds for which the rate limit that this request violated was enforced. |
| Rate Limiting Action Limit ID | Indicates the ID of the rate rule that the request violated. |
| Rate Limiting Action Limit Name | Indicates the name of the rate rule that the request violated. |
| Rate Limiting Action Percentage | Reserved for future use. |
| Rate Limiting Action Start Epoch msec | Indicates when the rate limiting action was applied to the request. The date and time is reported in Unix time (a.k.a. POSIX time or Unix epoch). Time is reported in milliseconds instead of seconds. Please convert this value from milliseconds to seconds prior to leveraging it with Unix time functions. |
| Rate Limiting Action Type | Indicates the type of action that was applied to the request. Valid values are: ALERT: Alert Only REDIRECT_302: Redirect (HTTP 302) CUSTOM_RESPONSE: Custom Response DROP_REQUEST: Drop Request (503 Service Unavailable response with a retry-after of 10 seconds) |
| Rate Limiting Action URL | Indicates the URL to which the request was redirected. |
| Rate Limiting Enforcement Duration | Indicates the minimum length of time, in seconds, that eligible requests were rate limited when the event took place. Example: This example assumes that a duration of 280 seconds was reported for an event. This means that the rule’s rate limiting policy was enforced for a minimum of 4 minutes and 40 seconds. The actual duration of the enforcement period was determined by the length of time that requests exceeded the rule’s threshold. |
| Rate Limiting Enforcement Percentage | Indicates the percentage of eligible requests that were rate limited when the event took place. Example: A percentage of 20% indicates that 20% of eligible requests were rate limited when the event took place. In other words, if there are 1000 eligible requests per minute, then a predefined action (e.g., URL redirection) was applied to 200 requests. |
| Rate Limiting Enforcement Rule ID | Indicates the action that was applied to the rate limited request by its system-defined ID. |
| Rate Limiting Enforcement Start Epoch msec | Indicates when the rate limiting action was applied to the request. The date and time is reported in Unix time (a.k.a. POSIX time or Unix epoch). Time is reported in milliseconds instead of seconds. Please convert this value from milliseconds to seconds prior to leveraging it with Unix time functions. |
| Rate Limiting Enforcement Tuple ID | Indicates the ID of the rate rule that the request violated. |
| Rate Limiting Enforcement Tuple Name | Indicates the name of the rate rule that the request violated. |
| Rate Limiting Enforcement Type | Indicates the type of action that was applied to the rate limited request. |
| Rate Limiting Enforcement URL | Indicates the URL to which the request was redirected. |
| Referer | Indicates the request’s referrer as defined by the Referer request header. |
| Request Method | Indicates the request’s HTTP method. Example: HTTP_METHOD_GET |
| Scope ID | Identifies the system-defined ID of the Security Application Manager configuration that the request violated. |
| Scope Name | Identifies the name of the Security Application Manager configuration that the request violated. |
| Server Address | Indicates the IP address for the edge server that processed the request. |
| Server Name | Indicates the name of the edge server that processed the request. |
| Server Port | Indicates the port number on an edge server to which the client directed a request. Valid values are: 80: HTTP request 443: HTTPS request |
| Server Type | Indicates the type of server that handled the request. |
| URI | Indicates the request’s URL path and query string. This URL path starts directly after the hostname and it excludes the protocol and hostname. |
| URL | Indicates the URL of the request that triggered the rule violation. |
| User Agent | Indicates the user agent that submitted the request. This value is derived from the request’s User-Agent header. |
WAF Alerts
Use the WAF Alerts data source for historical and near real-time analysis of recent threats to site traffic. For example, use this data to:
- Visualize the time periods during which site traffic is most heavily targeted.
- Understand the variety, frequency, and severity of illegitimate traffic.
- Identify the countries from which illegitimate traffic originates.
- Identify key individual offenders by their IP address.
- Learn detailed information on the types of attack being mounted against your site.
Each WAF field is defined below.
| Field | Description |
|---|---|
| Account Type | Reserved for future use. |
| Acl ID | Indicates the system-defined ID of the access rule that the request violated. |
| Acl Name | Indicates the name of the access rule that the request violated. |
| Action Type | Indicates the type of action that was taken in response to the rule violation. Valid values are: BLOCK_REQUEST: Indicates that the request that violated a rule was blocked. ALERT: Indicates that an alert was generated in response to the rule violation. REDIRECT_302: Indicates that the request that violated a rule was redirected to the URL associated with the instance defined by the Instance Name field. CUSTOM_RESPONSE: Indicates that a custom response was returned to the client that submitted a request that violated a rule. |
| ASN | Indicates the autonomous system number (ASN) for the autonomous system (AS) from which the request originated. |
| Bytes In | Indicates the sum of the number of bytes read from both the requesting client and the origin server. Returns 0 for blocked requests. |
| Bytes Out | Indicates the number of bytes in the response sent from the edge server to the client. Returns 0 for blocked requests. |
| Cache Status | Indicates the cache status code that was generated by the request. This code indicates how the request was handled by the CDN with regards to caching. |
| City Name | Indicates the city from which the request originated. |
| Client Content Type | This field has been deprecated. Use the Content Type field instead. |
| Client IP | Identifies the IP address of the client from which the request originated. |
| Content Type | Indicates the media type (aka content type) for the requested content. Example: application/javascript |
| Country Code | Identifies the country from which the request originated by its country code. |
| Country Name | Identifies the country from which the request originated by its name. |
| Epoch Time | Indicates the timestamp, in Unix time (seconds), at which our CDN received the request. |
| Event ID | Indicates the unique ID assigned to the event. Pass this ID to the Get Event Log Entry endpoint to retrieve this event log entry. |
| File size | Indicates the size, in bytes, of the requested asset (i.e., response body). |
| Host | Indicates the Host header value sent in the client’s request to the CDN. |
| id | Reserved for future use. |
| Instance ID | Reserved for future use. |
| Instance Name | Reserved for future use. |
| IP Version | Reserved for future use. |
| LC | Reserved for future use. |
| Matched On | Indicates a variable that identifies where the violation was found. |
| Matched Value | Indicates the value of the variable defined by the Matched On field. Standard security practices dictate that measures should be taken to prevent sensitive data (e.g., credit card information or passwords) from being passed as clear text from the client to your origin server. Another incentive for encrypting sensitive data is that it will be logged by our system when an alert is triggered as a result of this data. If sensitive data cannot be encrypted or obfuscated, then it is strongly recommended to contact our technical customer support to disable logging for the Matched Value field. |
| Operator Name | Indicates how the system interpreted the comparison between the Operator Parameter and the Matched Value fields. Common operators are: BEGINSWITH: Begins with. Identifies a match due to a request element that started with the specified match value. CONTAINS: Contains. Identifies a match due to a request element that contained the specified match value. ENDSWITH: Ends with. Identifies a match due to a request element that ended with the specified match value. STREQ: Exact match. Identifies a match due to a request element that was an exact match to the specified match value. RX: Regex. Identifies a match due to a request element that satisfied the regular expression defined in the match value. EQ: Value match. Identifies a match due to a request element that occurred the exact number of times defined in your custom rule. IPMATCH: IP Address. Identifies a match due to the request’s IP address either being contained within an IP block or that was an exact match to an IP address defined in your custom rule. |
| Operator Parameter | Indicates the source or the value that was compared against the Matched Value field. |
| Pipeline Time | Indicates the number of seconds between when the request was received by our network and ingestion. |
| Platform | Returns cache. |
| POP | Identifies the POP that handled the client’s request by its three-letter abbreviation. |
| Profile ID | Indicates the system-defined ID of the managed rule that the request violated. |
| Profile Name | Indicates the name of the managed rule that the request violated. |
| Profile Type | Indicates whether the request was screened as a result of a production or audit rule. |
| Receiving Host | Indicates the name of the server that inspected the request. |
| Referer | Indicates the request’s referrer as defined by the Referer request header. |
| Request Method | Indicates the request’s HTTP method. Example: HTTP_METHOD_GET |
| Rule ID | Indicates the ID for the rule that the request violated. This field indicates that the rule met or exceeded the maximum anomaly score. Please refer to the Sub Event(s) section, which contains a sub event for each rule violated by a request, to find out why the request was flagged or blocked. Each sub event indicates the rule that was violated and the data used to identify the violation. |
| Rule Message | Provides a description of the rule that the request violated. Syntax: Inbound Anomaly Score Exceeded (Total Score: 3, SQLi=0, XSS=0): Last Matched Message: Rule Message This term represents the message for the last rule that the request violated. This field indicates the request’s anomaly score and the last rule that it violated. Please refer to the Sub Event(s) section, which contains a sub event for each rule violated by a request, to find out why the request was flagged or blocked. Each sub event indicates the rule that was violated and the data used to identify the violation. |
| Rule Tags | Indicates the tags associated with the rule that the request violated. These tags may be used to determine whether a rule, access control, or global setting was violated. Naming convention: Rule Set/Category/Subcategory A category identifies whether the request violated a rule, an access control, or the delivery profile. The following sample values identify a policy: OWASP_CRS/PROTOCOL_VIOLATION/INVALID_HREQ and OWASP_CRS/WEB_ATTACK/SQL_INJECTION The following sample values identify a blacklist criterion: BLACKLIST/IP, BLACKLIST/COUNTRY, BLACKLIST/REFERRER, and BLACKLIST/URL The following sample value identifies a setting: OWASP_CRS/POLICY/SIZE_LIMIT |
| Rules Config ID | Indicates the ID of the custom rule that the request violated. |
| Rules Config Name | Indicates the name of the custom rule that the request violated. |
| Scope ID | Indicates the system-defined ID of the Security Application Manager configuration that the request violated. |
| Scope Name | Indicates the name of the Security Application Manager configuration that the request violated. |
| Server Address | Indicates the IP address for the edge server that processed the request. |
| Server Name | Indicates the name of the edge server that processed the request. |
| Server Port | Indicates the port number on an edge server to which the client directed a request. Valid values are: 80: HTTP request 443: HTTPS request |
| Sub Event Count | Indicates the number of rules that the request violated. |
| Sub Events | Reserved for future use. |
| Total Anomaly Score | Indicates the anomaly score assigned to the request. This score is determined by the number of rules that were violated and their severity. |
| URL | Indicates the URL of the request that triggered the rule violation. |
| User Agent | Indicates the user agent that submitted the request that triggered the rule violation. This information is derived from the User-Agent request header. |