


The Threats dashboard provides an avenue through which a historical analysis of recent threats to site traffic may be performed. This type of an analysis provides the means through which you may:
- Visualize the time periods during which site traffic is most heavily targeted.
- Understand the variety, frequency, and severity of illegitimate traffic.
- Identify the countries from which illegitimate traffic originates.
- Identify key individual offenders by their IP address.
- Learn detailed information on the types of attack being mounted against your site.
Log data is retained for 30 days for most security solutions. The exception is Security Insights which only retains data for 7 days.
Usage
The dashboard contains two different views through which threat analysis may be performed, which are:
To view the Threats dashboard
-
Navigate to the Threats dashboard (Threats tab of the Overview page).
- From the Edgio Developer console, select the desired team space.
- From the Security section, click Overview.
- Verify that the Threats tab is active.
The dashboard will display a chart showing recent violations of your security policy.
-
Optional. View event log data by clicking Event Logs from the navigation pane. Verify that the Threats tab is active.
Focus on relevant or critical events by applying a filter to the dashboard.
Overview
Use the Overview to detect patterns for objectionable traffic directed at your applications and web servers. This view consists of a chart and statistics.
-
Chart: A chart or line graph displays the number of threats detected over a given time period.
By default, a single line on the graph represents all threats. Alternatively, categorize threats by selecting the desired categorization criteria from the option that appears directly above the graph. A line will be drawn on the chart for each unique value. For example, if you select Profile Type and requests were screened by production and audit rules, then the graph will contain a line for audit and another one for production.
By default, graphing threats by type will include up to the 10 most popular entries. Customize this limit through the Max Top Number option. This option also affects the maximum number of unique entries that may be listed for each type of statistic listed under the graph.
-
Statistics: Statistics on the threats detected over a given time period are displayed directly below the chart. Statistics are broken down by category.
By default, statistics for up to the 10 most popular entries may be displayed for each category. Customize this limit through the Max Top Number option. This option also affects the maximum number of lines that may be graphed.
The following information is displayed for each category:
-
<Value>: Groups threats by the request’s value for the current category. The following illustration shows a partial listing of values for theRule Messagecategory.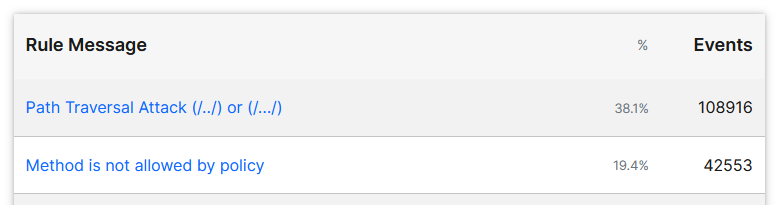
-
%: Indicates the percentage of detected threats over a given time period that belong to the group identified by the Value field.
Percentages are calculated from the total threats detected during the given time period. The Max Top Number option determines the limit of entries per category. If the number of entries exceeds this limit, then the sum of the percentages for that category will not add up to 100%.
-
Events: Indicates the number of detected threats that belong to the group identified by the Value field.
-
Key information:
- By default, a chart includes all rule violations within the last
seven days.
- The chart may be filtered by the criteria listed directly below it. Additional filters are available when viewing an individual alert from the event log.
- The time period being charted may be adjusted through the Time
Range option.
- This option is displayed directly to the left of the chart.
- The unit associated with the selected time period determines whether events will be graphed by minute, hour, or day.
- A timeline, which appears directly below the chart, displays a
mini-chart for the time period defined by the Time Range
option. Use this timeline to update the chart to only display data
for either of the following time periods:
- Custom Time Period: Click and drag anywhere in the timeline to update the chart to only display the selected time period.
- Entire Time Period: Click anywhere in the timeline to clear the selection. After which, the chart will now display the entire time period defined by the Time Range option.
- Hovering over the line graph will indicate the exact number of warnings that took place during that time slot.
Event Log View
This view provides the means to delve into the details of an illegitimate request. The information derived from this view provides a deeper understanding as to why a request was deemed objectionable and the type of attacks being mounted on an origin server.
The event log contains a list of recent rule violations. The header bar for each violation contains the following information:
<Rule Message>: Identifies the rule that was violated.<Elapsed Time>: Indicates the amount of time that has passed since the request was screened.<Time>: Indicates the time (UTC) at which the request was screened.
Syntax:
<Rule Message> [<Elapsed Time> <Time>]
Example:
Access rule for Marketing site [10s ago 15:01:23.45 UTC]
Field Definitions
Clicking on an event (i.e., rule violation) expands that entry to show detailed information about it. Each event field is described below.
-
Timestamp: Indicates the point-in-time at which the rule violation occurred. This timestamp is reported using a 24 hour time format (UTC/GMT).
Format:
<YYYY>-<MM>-<DD> <hh>:<mm>:<ss>.<milliseconds>Example:
2023-07-08 15:00:22.123 -
Managed Rules Name: Indicates the name of the managed rule set that was violated. If a managed rule was not violated, then this field will be empty.
-
Rule Message: Provides a description of the rule that the request violated. The syntax for this field varies according to the type of rule that was violated.
-
Managed Rule Set - Anomaly Score: This field indicates the request’s anomaly score and the last rule that it violated. Please refer to the Sub Event(s) section, which contains a sub event for each rule violated by a request, to find out why the request was flagged or blocked. Each sub event indicates the rule that was violated and the data used to identify the violation.
Inbound Anomaly Score Exceeded (Total Score: <#>): Last Matched Message: <Rule Message> -
Syntax (All Other Rule Sets):
<Rule Message>
-
-
Event ID: Indicates the system-defined ID assigned to this event (i.e., rule violation).
-
Security Application Name: Indicates the name of the Security Application Manager configuration that was assigned the rule set that was triggered.
-
Profile Type: Indicates whether the request was screened as a result of a production or audit rule.
-
Country Name: Identifies the country from which the request originated by its name.
-
Action Type: Indicates the type of action that was taken in response to the rule violation. Valid values are:
- BLOCK_REQUEST: Indicates that the request that violated a rule was blocked.
- ALERT: Indicates that an alert was generated in response to the rule violation.
- REDIRECT_302: Indicates that the request that violated a rule was redirected to the URL associated with the instance defined by the Instance Name field.
- CUSTOM_RESPONSE: Indicates that a custom response was returned to the client that submitted a request that violated a rule.
-
Client IP: Identifies the IP address of the client from which the request originated.
-
URL: Indicates the URL of the request that triggered the rule violation.
-
Referer: Indicates the request’s referrer as defined by the
Refererrequest header. -
User Agent: Indicates the user agent that submitted the request that triggered the rule violation. This information is derived from the
User-Agentrequest header.
Sub Events
In addition to the core set of fields described above, a sub event for each rule that was violated by the request will be reported. The syntax for the header bar associated with each sub event is described below.
Rule ID: <Rule ID>
Rule Message: <Rule Message>
Each sub event contains the following fields:
- Matched On: Indicates a variable that identifies where the violation was found.
- Matched Value: Indicates the value of the variable defined by the Matched On field.
Standard security practices dictate that measures should be taken to prevent sensitive data (e.g., credit card information or passwords) from being passed as clear text from the client to your origin server. Another incentive for encrypting sensitive data is that it will be logged by our system when an alert is triggered as a result of this data. If sensitive data cannot be encrypted or obfuscated, then it is strongly recommended to contact our technical customer support to disable logging for the Matched Value field.
-
Rule ID: Indicates the ID for the rule that the request violated.
-
Rule Message: Provides a description of the rule that the request violated.
-
Operator Name: Indicates how the system interpreted the comparison between the Operator Parameter and the Matched Value fields. Common operators are:
- BEGINSWITH: Begins with. Identifies a match due to a request element that started with the specified match value.
- CONTAINS: Contains. Identifies a match due to a request element that contained the specified match value.
- ENDSWITH: Ends with. Identifies a match due to a request element that ended with the specified match value.
- STREQ: Exact match. Identifies a match due to a request element that was an exact match to the specified match value.
- RX: Regex. Identifies a match due to a request element that satisfied the regular expression defined in the match value.
- EQ: Value match. Identifies a match due to a request element that occurred the exact number of times defined in your custom rule.
- IPMATCH: IP Address. Identifies a match due to the request’s IP address either being contained within an IP block or that was an exact match to an IP address defined in your custom rule.
-
Operator Parameter: Indicates the source or the value that was compared against the Matched Value field.
-
Rule Tags: Indicates the tags associated with the rule that the request violated. These tags may be used to determine whether a rule, access control, or global setting was violated.
Naming convention:
<Rule Set>/<Category>/<Subcategory><Category>identifies whether the request violated a rule, an access control, or the delivery profile.Example values:
-
Policy: The following sample values identify a policy:
OWASP_CRS/PROTOCOL_VIOLATION/INVALID_HREQOWASP_CRS/WEB_ATTACK/SQL_INJECTION -
Blacklist: The following sample values identify a blacklist criterion:
BLACKLIST/IPBLACKLIST/COUNTRYBLACKLIST/REFERRERBLACKLIST/URL -
Setting: The following sample values identify a setting:
OWASP_CRS/POLICY/SIZE_LIMIT
-
-
Total Anomaly Score: Indicates the anomaly score assigned to the request. This score is determined by the number of rules that were violated and their severity.
Filters
Filters are applied to both the Overview and the Event Log views. Most fields support filtering.
The Overview and the Event Log views cannot be filtered by the Timestamp field. Use the Time Range option instead. This option filters the dashboard for events that occurred during a relative time period from the present (e.g., Last 24 hours or Last 7 days).
Key information:
-
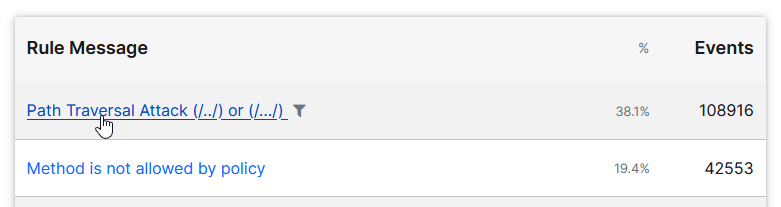
Most filters may be applied by clicking on the desired entry. After which, the
 (filter) icon
will be displayed next to it. This icon indicates that the dashboard
is being filtered by that entry.
(filter) icon
will be displayed next to it. This icon indicates that the dashboard
is being filtered by that entry.-
Overview: Look for the statistics shown under the graph and then click on the desired value to filter for all requests that match it.
-
Event Log: Expand a rule violation and then click on the desired field value.
Filtering by rule message or ID filters for the selected rule and all other rules that contributed to the violation of the anomaly score threshold.
Blue font indicates a field value that may be applied as a filter to the dashboard.
-
-
The Time Range option is different from other filters in that it is mandatory. Specify the time period by which the Overview and the Event Log will be filtered.
-
The Filters section, which appears on the left-hand side of the dashboard, displays a list of active filters. It also allows a filter to be cleared by clicking on the
 (delete)
icon displayed next to
it.
(delete)
icon displayed next to
it.