

Edgio’s Managed Bot Defense introduces a new layer of security dedicated to bot detection and mitigation. Managed Bot Defense is agile, intelligent, configurable, and adapatable to changing threats. It provides deep, actionable analysis of all internet traffic, web reconnaissance, automated bots, and legitimate website visitors.
Getting Started
Get started with Managed Bot Defense by requesting that we activate it on your account. After which, we will set it up for you. No additional configuration is required on your part.
Contact your account manager or our sales department at 1 (866) 200 - 5463 to upgrade your account.
Viewing Reports
Managed Bot Defense reports data on a per environment basis. View a report by performing the following steps:
- From the Edgio Developer console, load the desired property.
- From within the Environments tab, click on the desired environment.
- Click on the Bot Management tab.
- From the left-hand pane, click on the desired report.
Real-Time Dashboard
Use our Real-Time dashboard to gain insight into:
- Visitor Patterns: Review near real-time visitor patterns over the last few minutes, hours, or even days. Visitors are tracked according to whether they were blocked (i.e., mitigated), trusted, or allowed to pass through our network after inspection (i.e., unmitigated). Look for a sudden increase in traffic levels, since that can be a precursor to something more concerning.
- Total Traffic Percentage: Compare aggregate mitigated and unmitigated traffic levels against total traffic.
- Additional Statistics: View statistics for the top countries, data centers, and user agents as determined by total traffic.
Cross-reference unexpected spikes or dips in the Real-Time dashboard with the Scrapers dashboard.
This dashboard is updated every minute with data from 3 minutes ago.
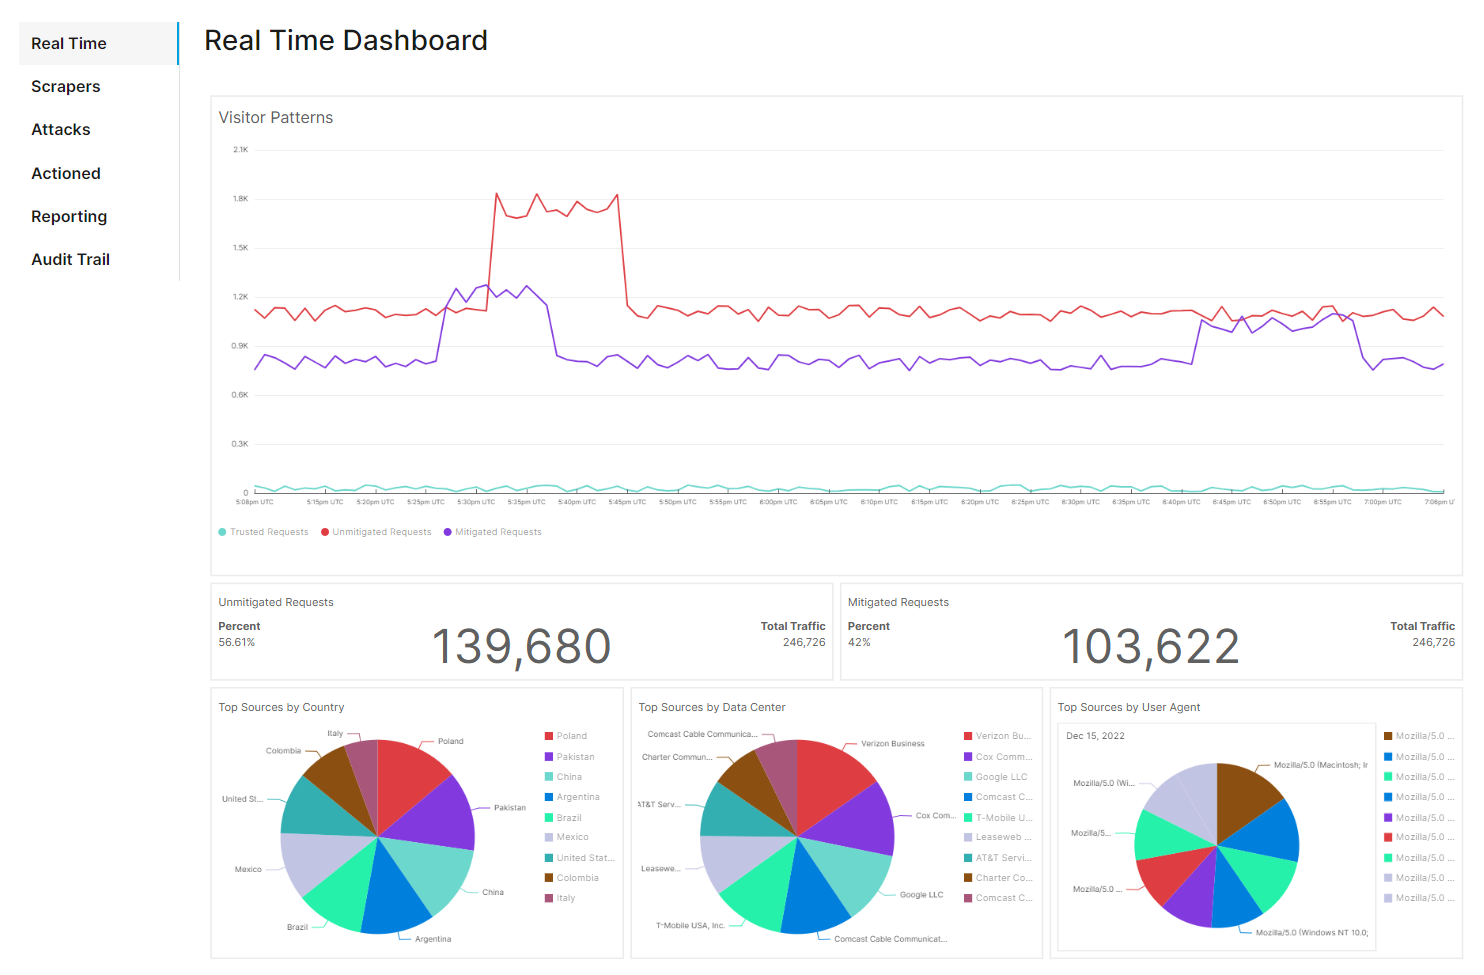
By default, this dashboard displays activity for the current day. Perform the following steps to adjust the dashboard’s date range:
- Click on the Controls section.
- Click on the start date to display a calendar.
- Click on the desired start date.
- Click on the desired end date.
- Optional. By default, the start and end time are set to midnight. You may adjust these settings as needed.
- Click off of the calendar to hide it.
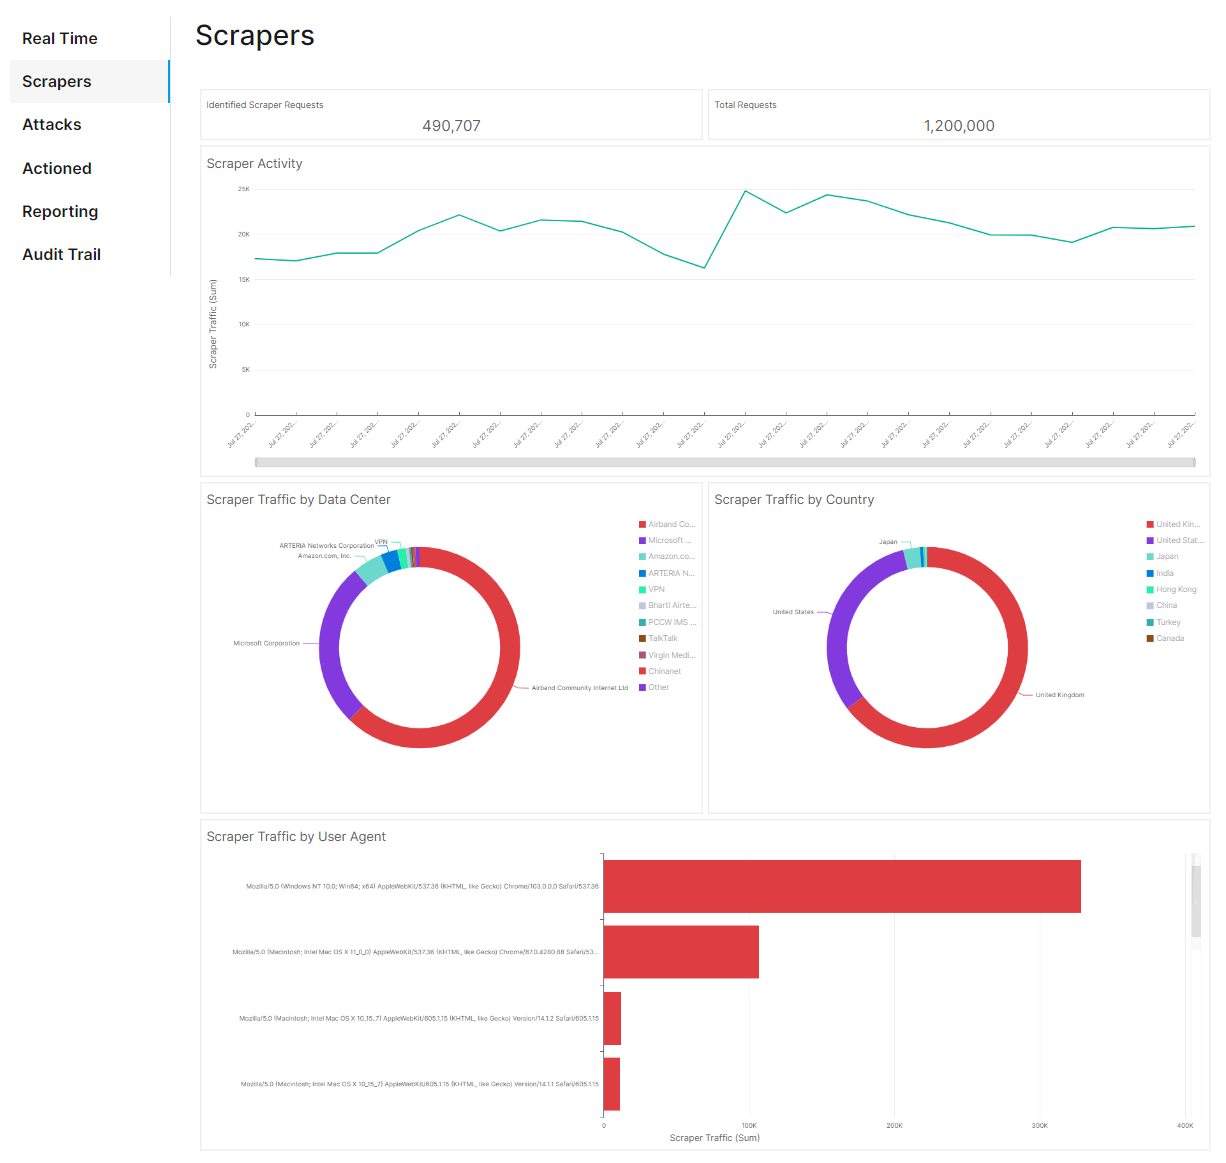
Scrapers Dashboard
Use the Scrapers dashboard to analyze data scraping activity. This activity is broken down by:
- Identified Scraper / Total Requests: Review total data scraping requests and compare that to total traffic requests.
- Scraper Activity: Review scraping activity over the last few minutes, hours, or even days.
- Additional Statistics: Review scraping activity by data center, country, and user agent.
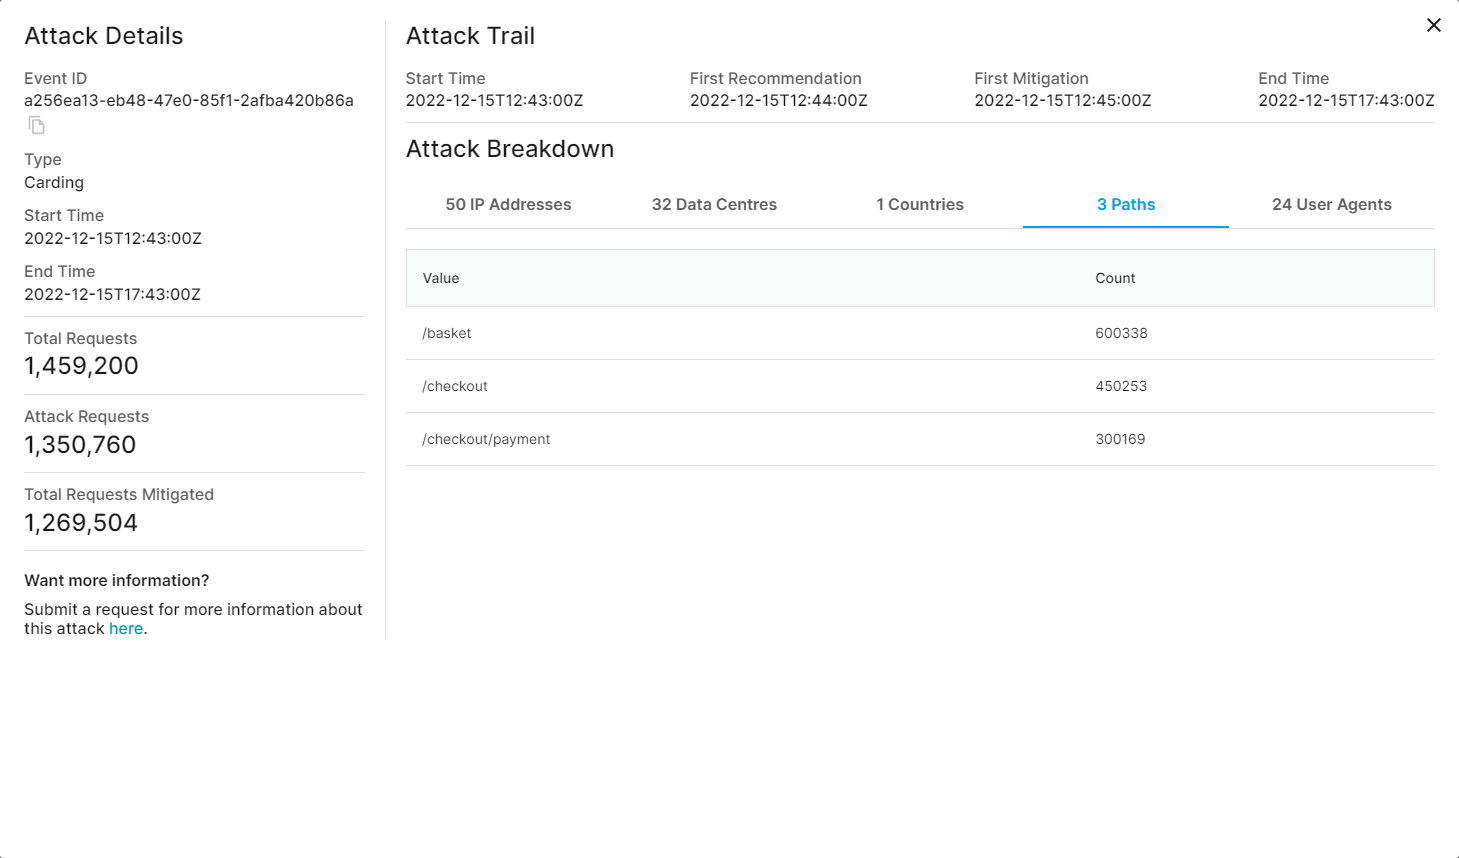
Attacks
Review the attacks on your site from the Attacks page. Use this information to understand the intent of the attack (e.g., credential stuffing, fake account creation, or account takeover), the timeline of the attack, and how it was mitigated.
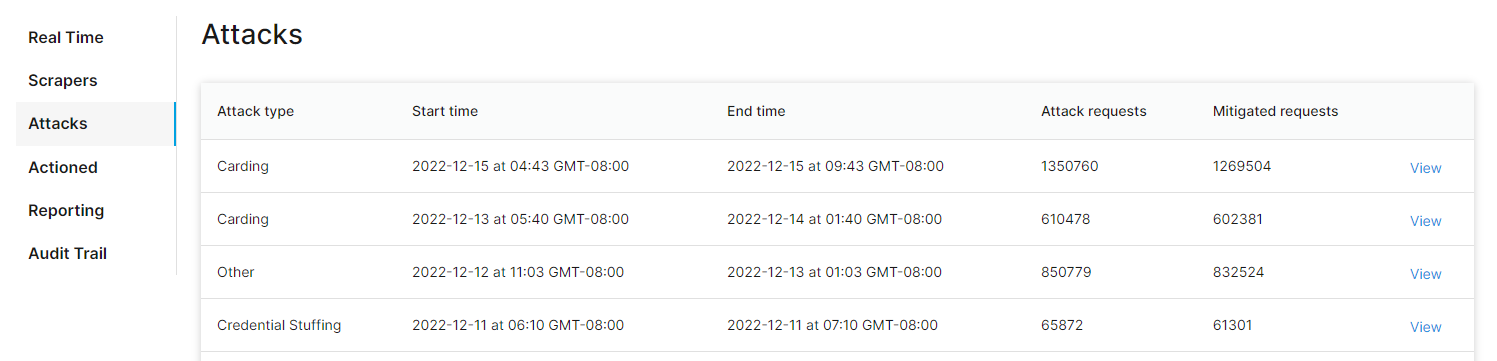
You can dig into a specific attack by clicking View. In addition to basic attack information, you can find out when we started mitigating the attack and a breakdown of the IP addresses, data centers, countries, URL paths, and user agents involved in the attack.
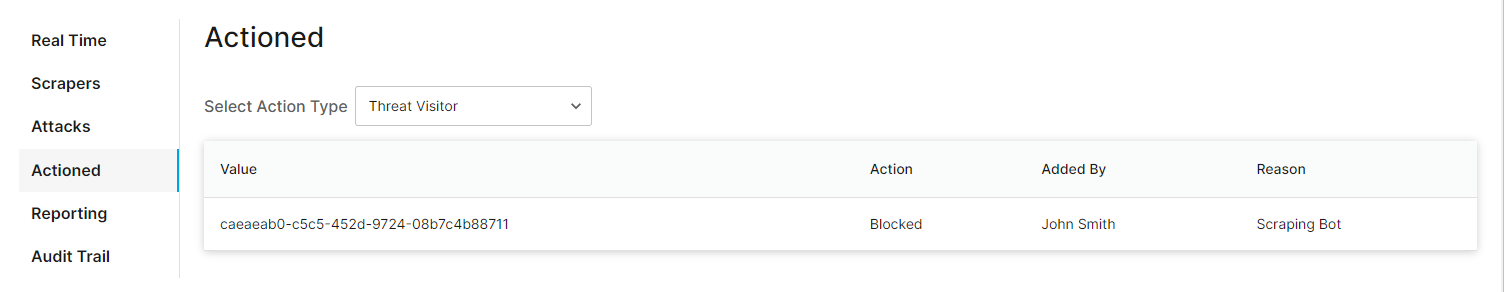
Actioned
From the Actioned page, view threat and trusted lists for visitors, IP addresses, user agents, and data centers. A threat list identifies a source of questionable traffic that will be automatically mitigated (e.g., blocked or served a CAPTCHA), while a trusted list identifies a source of traffic that will not be screened by Managed Bot Defense since it is considered legitimate.
Reporting Dashboard
Use our Reporting dashboard to analyze mitigated, unmitigated, and trusted requests. In addition to providing basic statistics, this dashboard allows you to visualize traffic patterns by request type. It also breaks down each request type by country, data center, and user agent.
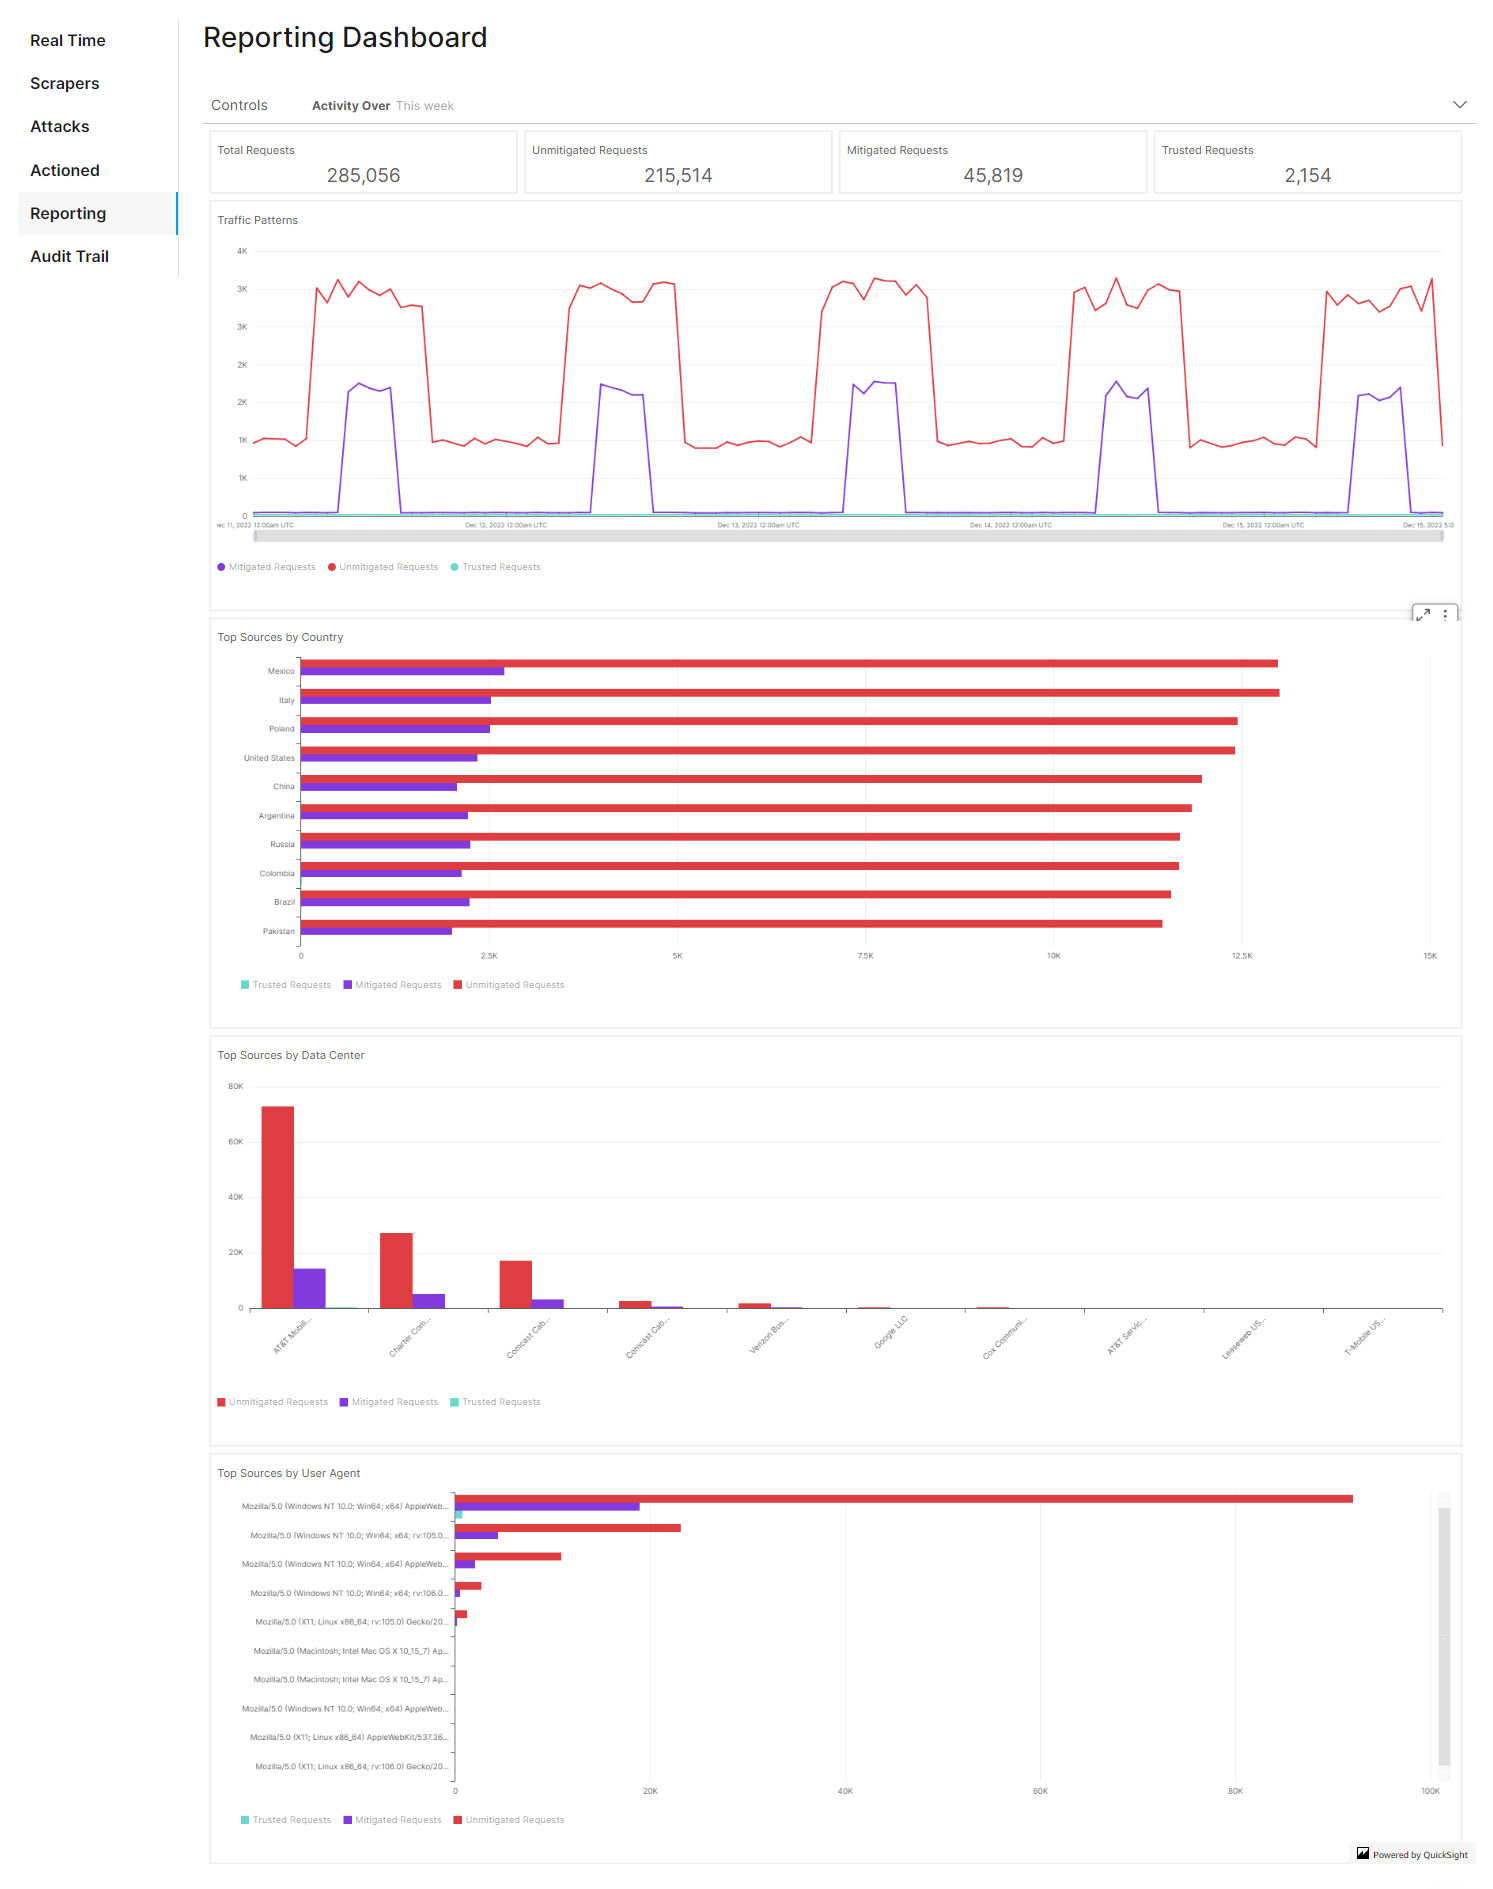
By default, this dashboard displays activity for the current month. Perform the following steps to adjust the dashboard’s date range:
- Click on the Controls section.
- Click on the start date to display a calendar.
- Navigate to the desired month and then click on the desired start date.
- Click on the desired end date.
- Optional. By default, the start and end time are set to midnight. You may adjust these settings as needed.
- Click off of the calendar to hide it.
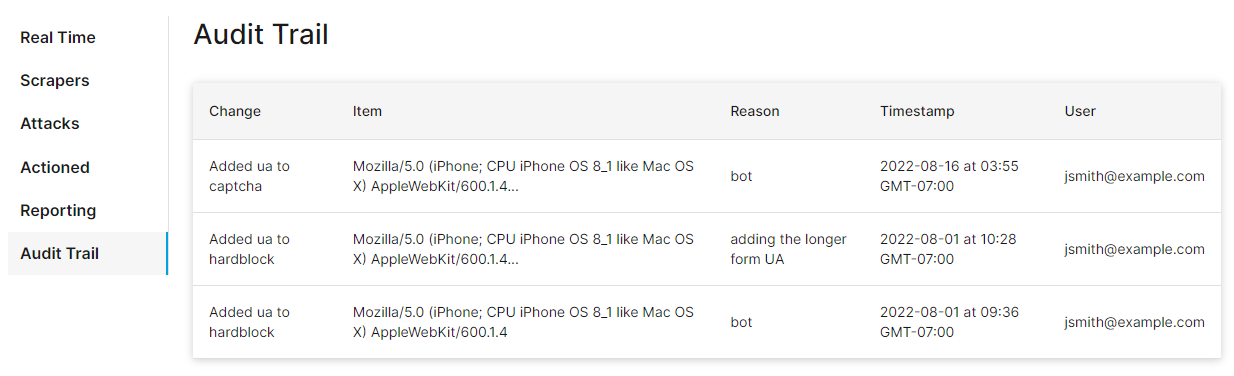
Audit Trail
Review changes to your Managed Bot Defense configuration from the Audit Trail page. Use this audit trail to track recent configuration changes or to investigate why traffic was blocked. This audit trail reveals what the change was, the reason for this change, when it was made, and by whom.