


This guide shows you how to troubleshoot applications running on Edgio. Below are some steps to follow when working locally or attempting to address site performance.
Server Timings
When measuring the performance of your server, we provide numerous headers to decipher timings of requests. Visit our section on response headers for an in-depth explanation on the values available and how to leverage them.
Visual Studio Code
To debug a Edgio application in Visual Studio Code:
- Open
.vscode/launch.json. - Click Add Configuration… and select Node.js: Launch Program.
Edit the resulting configuration to look like this:
1{2 "name": "Debug Edgio App",3 "type": "node",4 "request": "launch",5 "cwd": "${workspaceFolder}",6 "autoAttachChildProcesses": true,7 "program": "${workspaceFolder}/node_modules/@edgio/cli",8 "args": ["run"]9}
The above assumes that the workspace folder is your app’s root directory. If that is not the case, adjust program and cwd accordingly. The program config should always point to @edgio/cli. The cwd config should point to the root directory of your app.
Note that this configuration will allow you to set breakpoints in both your Edgio router as well as your application code (for example in Next.js, Nuxt.js, Angular, etc…).
Logs
Edgio provides two types of logs to help you debug issues with your application.
Server Logs
By viewing the server logs in the Edgio Developer console, you can see all of the messages logged by your application using console.log, console.warn, etc…
By enabling Deep Request Inspection in your environment, you can also see the headers and body of every request and response served by your application via the Edgio serverless cloud. You can also see each upstream API request made by your application.
You can also use the server logs to debug routing issues going to custom backends by temporarily moving the proxy from the edge to serverless:
1.get('/p/:productId', ({ cache }) => {2 proxy('origin', {3 // The presence of transformRequest and transformResponse ensure that proxying is done in serverless, not at the edge.4 transformRequest: (req) => {5 console.log('Request ID', req.headers['x-request-id'])6 // Log request properties that you want to troubleshoot.7 },8 transformResponse: (res, req) => {9 console.log('Response for request ID', req.headers['x-request-id'], 'status code', res.statusCode)10 // Log response properties that you want to troubleshoot.11 }12 })13 })
Once you have this deployed, you can observe the output in your server logs.
Note that whenever possible, we strongly recommend to always proxy the traffic from the edge, as that is more performant and avoids serverless surcharges. The solution above should only be used as a temporary measure while addressing issues.
Access Logs
Access logs contain information about all requests, even those that never reach your application code (e.g. cache hits, static assets, requests routed to custom backends, edge redirects, and so on).
Confirming Behavior with CURL
Removing the browser as a variable in your equation is a good way to confirm what the origin server is doing. Below are a few of the common CURL commands we leverage to verify behavior.
The option -k will not validate a SSL certificate if that is not yet configured.
View Headers Only
1curl -o/dev/null -vv https://www.yoursite.com
Bypass DNS Resolution
Connect directly to the address listed after. This is good for sending a request straight to origin and bypassing Edgio, or testing a connection to Edgio before DNS cutover. Setting up a localhost DNS configuration is usually better for this if possible.
1curl -o/dev/null -vv2 https://www.yoursite.com --connect-to ::35.241.39.58
Specify a Cookie
Typically used for A/B test validation.
1curl -o/dev/null -vv2 -H "Cookie: cache_enabled=true" https://www.yoursite.com/main.js
Send a Specific User agent
1curl -o/dev/null -vv2 -H "User-Agent: Mozilla/5.0 (iPhone; CPU iPhone OS 13_6_1 like Mac OS X) AppleWebKit/605.1.15 (KHTML, like Gecko) Mobile/15E148 [FBAN/FBIOS;FBDV/iPhone10,2;FBMD/iPhone;FBSN/iOS;FBSV/13.6.1;FBSS/3;FBID/phone;FBLC/en_GB;FBOP/5];FBNV/1"
Skip the Cache
Adding a edgio_debug=true to the query parameter will skip the cache and make it easy to check for dynamic data (i.e. personalized content). Append grep to search for specific values within the response output.
1curl -vv --silent https://www.yoursite.com/?edgio_debug=true 2>&1 | grep minicart-quantity
2>&1 is only present to make terminal work with grep
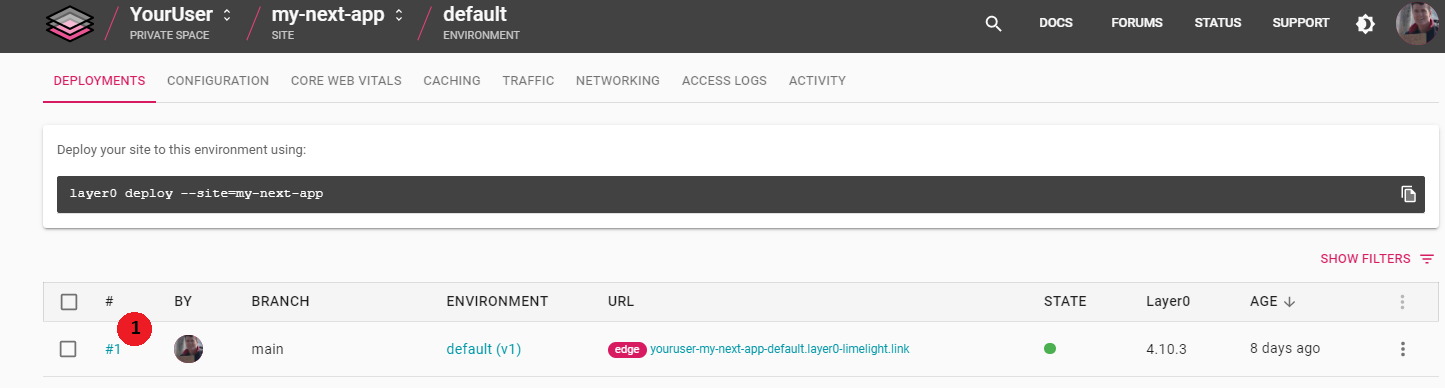
Checking your Permalinks vs Edge links
A Permalink request will skip the edge (cache) and go straight to the serverless tier. This will likely degrade performance, but does allow for verification of a function.
The edge link will route through the edge.
You can find both links on the detail page of a deployment.
Cache Reasons
We provide a header, x-0-caching-status to best understand why something is being cached. There is a detailed guide available on deciphering those reasons.
Source Maps
Edgio automatically produces a source map for your router file so that all runtime errors that occur during routing will have a stacktrace that references the original source file. If your application build produces source maps for the server bundle, these will also be used when reporting errors. Edgio provides a convenient way to enable source maps when using Next and Nuxt:
We noticed some performance issues related to sourcemaps being loaded in our Serverless infrastructure, which may result in 539 project timeout errors. In case you encounter such errors, please try again with sourcemaps disabled. This document will be updated once the problem is fully resolved.
Next.js
Set edgioSourceMaps: true in your next.config.js:
1const { withEdgio, withServiceWorker } = require('@edgio/next/config')23module.exports = withEdgio(4 withServiceWorker({5 // Output sourcemaps so that stacktraces have original source filenames and line numbers when tailing6 // the logs in the Edgio Developer console.7 edgioSourceMaps: true,8 }),9)
Nuxt.js
Set edgioSourceMaps: true in the config for @edgio/nuxt/module in buildModules in nuxt.config.js:
1module.exports = {2 // ...3 buildModules: [['@edgio/nuxt/module', { edgioSourceMaps: true }]],4 // ...5}
Note: The reason that application level source maps are not enabled by default is that they can be quite large and cause the serverless bundle to be larger than the 50MB limit.
Troubleshooting 539 Status Codes
Overview
539 status codes (see Status Codes) are timeout errors, which can be:
- An error in your SSR code
- A backend error (server overloaded or offline)
- An allowlist issue
We noticed some performance issues related to sourcemaps being loaded in our Serverless infrastructure, which may result in 539 project timeout errors. In case you encounter such errors, please try again with sourcemaps disabled. This document will be updated once the problem is fully resolved.
Assumptions
You have deployed your site to Edgio. All your website code resides with Edgio as SSR (server-side rendering) code. Your backend (server) simply contains data that is needed by your website code to construct a page and return it to a requesting client or browser. See Architecture for more information.
Typical Request Flows
Following are two request flows that are helpful as background to troubleshooting information.
Cached Assets Served
- A requesting client sends a request to Edgio for an asset.
- The Edgio edge finds the asset in cache and returns it to the client.
Assets Served via Customer SSR Code and Customer Backend
This flow is where 539 errors might occur.
- A requesting client sends a request to Edgio for an asset.
- Edgio does not find it in its cache and examines routing rules.
- Edgio sends requests to SSR code.
- The SSR code makes calls to the customer backend to get data needed for the page.
- The SSR assembles the page and sends it to the Edgio edge.
- The Edgio edge caches the page and returns it to the client.
Note: a variant on caching is ISR where Edgio caches just for a few hours or days.
Allowlist Overview
When you run your site on Edgio, all requests come in through four IP addresses, and servers are programmed to interpret this as a DDoS attack. At this point, the server either blocks or rate-limits the requests. In either case, timeouts occur and 539 errors are returned.
A typical pattern is that your site works fine for a few days after deploying to Edgio, then your server starts interpreting the requests as a DDoS attack.
To prevent this scenario, you must configure your server with allowlisted Edgio IP addresses. See Allow Edgio IP Addresses.
Procedure
When you are testing a web page, you might encounter 539 status code errors. You might also see the errors in logs if you signed up for Log Shipping.
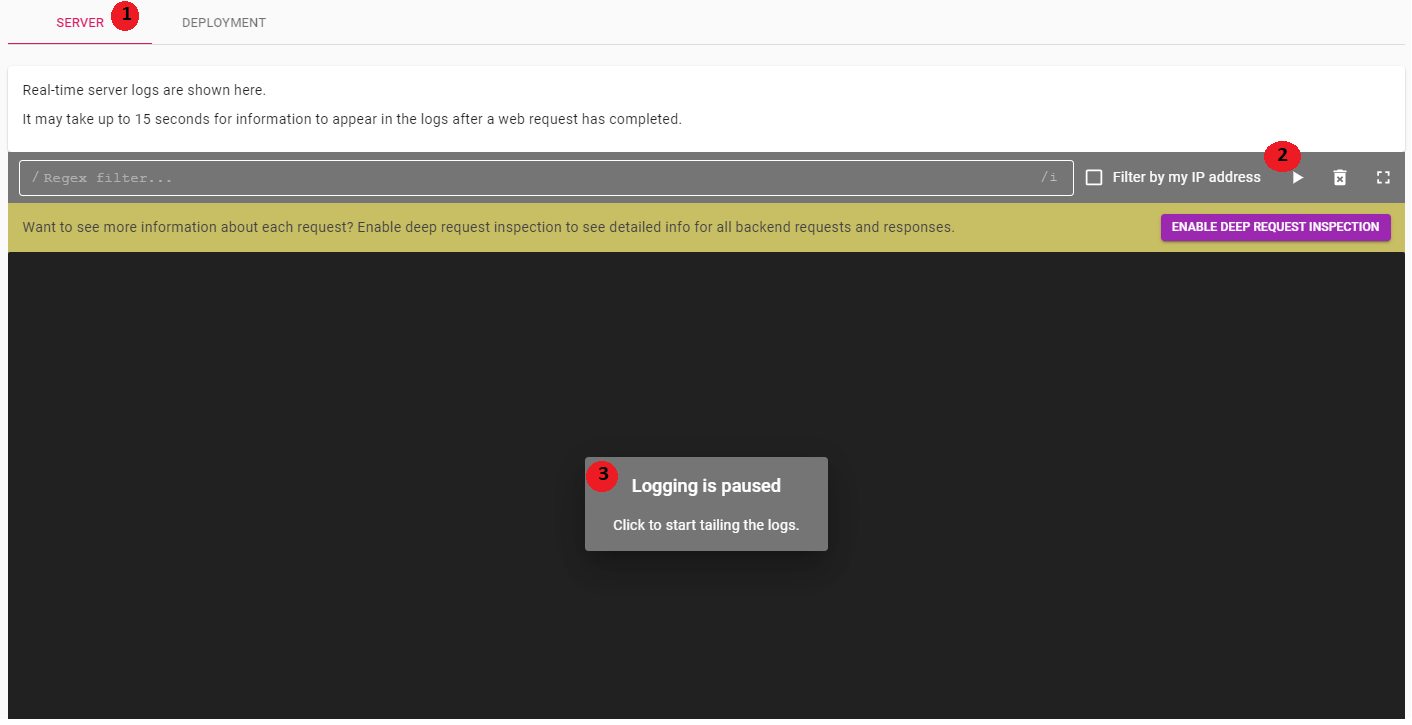
- Open your project in Edgio, then drill down to the deployment that is experiencing the 539 errors.
- Click the SERVER tab header at the bottom of the page, then click the Resume logs arrow or the Logging is paused link to resume logging.
If you see 539 errors, the issue could be any of the following:
- An error in your SSR code
- A problem with the backend server
- An allowlist error
Good Request Example
Before continuing, it is helpful to see what a good request and response flow looks like. A request with no errors has four lines:
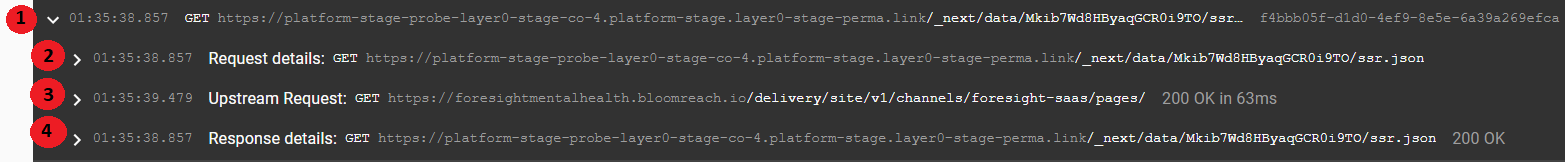
| Line | Description |
|---|---|
| 1 | Summary line. |
| 2 | The request from Edgio to your SSR code. The line ends with a 200, indicating success. |
| 3 | The request from your SSR code to your backend server. If this line ends with a <status code> in XXms, then the SSR received a response from your backend server. In this example the HTTP status code was 200, indicating success. If the line does not end with a <status code> in XXms, there was a problem with the request to your backend server (see Backend Server Error). |
| 4 | The response from the SSR to the browser, and ends with the status code for the response. If this line is present, the SSR code ran to completion. If this line is missing there was a problem (see Error in SSR Code). |
Error in SSR Code
If a request looks like the following, your SSR code contains an error.

| Line | Description |
|---|---|
| 1 | Summary line. |
| 2 | The request from the Edgio edge to your SSR code. The line ends with a 200. |
| 3 | The request from your SSR code to your backend server. The line ends with a 200. |
Note: There is no response from the SSR code to the browser as shown in line 4 in Good Request Example. Troubleshoot your code and fix the error. Common errors are that your SSR code:
- Took too long to return a response
- Threw an exception and never returned a response
Backend Server Error
If a request looks like the following, your backend server is either down, overloaded or has an allowlist error.

| Line | Description |
|---|---|
| 1 | Summary line. |
| 2 | The request from the Edgio edge to your SSR code. |
| 3 | The request from your SSR code to your backend server. |
Note: If line 3:
- Ends in a status code other than
200, then the SSR code received a non-200code from the backend server. - Does not end in a status code at all, then the SSR did not receive a response from the backend and the problem can be either an allowlist error or a timeout error. See “Distinguishing an Allow List Error from a Timeout Error.” See Distinguishing an Allowlist Error from a Timeout Error.
Distinguishing an Allowlist Error from a Timeout Error
To determine if there is an allowlist error, do the following:
- Expand line 3 (request from your SSR code to your backend server) and select
COPY AS CURL
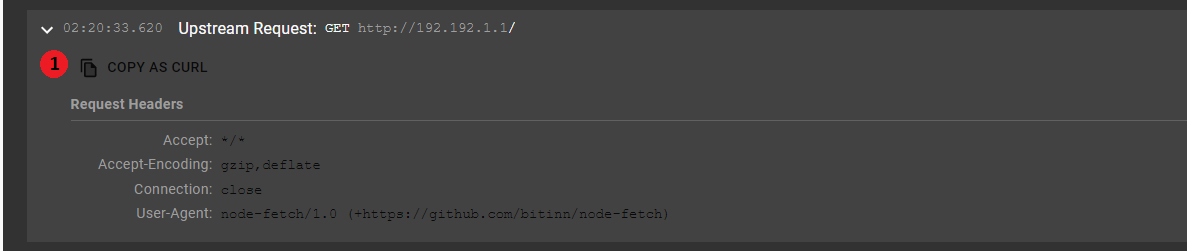
- Run the
curlcommand. (The command runs the same request that the SSR code made to the backend server, but from your local machine.)
The outcome will be either SSR code error or an allowlist error.
SSR Code Error
If the command fails or does not respond, there is an error in your code, most likely a badly formed request.
Troubleshoot your code to find and fix the error.
Allowlist Error
If the command succeeds and finishes quickly, it is probably an allowlist error. Contact your operations team and ask them to add the IP addresses in Allowlisting to your server’s IP allowlist.